

 Save
Save Print
Print
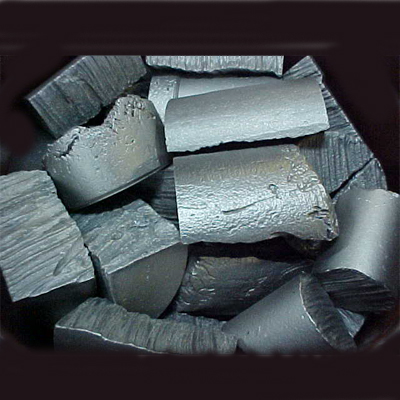
[Ferro-Alloys.com] According to data of China Custom, from January to July 2020, China's export of ferrosilicon (silicon content > 55%) was 177713.98 tons, a year-on-year decrease of 27.097%. Among them, 45695.89 tons were exported to South Korea, accounting for 25.713%; and 40923.61 tons were exported to Japan, accounting for 23.028%.
| Countries / Areas | Tons | $ | Ratio |
| Korea | 45695.89 | 48,397,389 | 25.713% |
| Japan | 40923.61 | 45,939,600 | 23.028% |
| Indonesia | 21716.487 | 22,836,867 | 12.220% |
| Taiwan, China | 12681.935 | 12,618,704 | 7.136% |
| India | 11527.354 | 9,693,234 | 6.486% |
| Vietnam | 10519.55 | 10,654,622 | 5.919% |
| Mexico | 5206.1 | 5,360,994 | 2.929% |
| Turkey | 5155.7 | 5,369,437 | 2.901% |
| Malaysia | 5012.211 | 5,268,102 | 2.820% |
| Thailand | 4367.95 | 4,552,367 | 2.458% |
| Chile | 3627 | 3,848,242 | 2.041% |
| Australia | 1361 | 1,448,255 | 0.766% |
| Egypt | 1323 | 1,355,067 | 0.744% |
| Bangladesh | 823 | 761,865 | 0.463% |
| UAE | 749 | 830,642 | 0.421% |
| Canada | 665 | 712,425 | 0.374% |
| Pakistan | 626 | 579,995 | 0.352% |
| Saudi Arabia | 498 | 499,968 | 0.280% |
| New Zealand | 480 | 480,720 | 0.270% |
| Philippines | 448 | 484,820 | 0.252% |
| Brazil | 384.64 | 408,575 | 0.216% |
| Ukraine | 361 | 305,629 | 0.203% |
| Myanmar | 340.969 | 271,248 | 0.192% |
| Greece | 300 | 310,500 | 0.169% |
| Bahrain | 297.3 | 332,135 | 0.167% |
| Guatemalan | 206 | 230,415 | 0.116% |
| Oman | 200 | 212,852 | 0.113% |
| Algeria | 200 | 200,000 | 0.113% |
| New Caledonia | 192 | 178,560 | 0.108% |
| Colombia | 186 | 188,180 | 0.105% |
| South Africa | 175 | 122,901 | 0.098% |
| Israel | 146 | 143,970 | 0.082% |
| Mongolia | 120.2 | 108,760 | 0.068% |
| Singapore | 114 | 119,040 | 0.064% |
| Albania | 100.08 | 110,167 | 0.056% |
| Hong Kong, China | 100 | 94,715 | 0.056% |
| Sudan | 100 | 107,600 | 0.056% |
| Ecuador | 100 | 114,020 | 0.056% |
| Angola | 79 | 83,060 | 0.044% |
| Syria | 60 | 57,600 | 0.034% |
| Ghana | 54 | 61,938 | 0.030% |
| Nigeria | 54 | 50,220 | 0.030% |
| Peru | 54 | 53,460 | 0.030% |
| Jordan | 50 | 53,065 | 0.028% |
| Georgia | 50 | 34,515 | 0.028% |
| Heishan | 50 | 49,000 | 0.028% |
| Qatar | 40 | 48,200 | 0.023% |
| Kuwait | 30 | 37,273 | 0.017% |
| Russian Federation | 30 | 35,400 | 0.017% |
| Iran | 26 | 38,770 | 0.015% |
| Slovenia | 25 | 23,250 | 0.014% |
| Uzbekistan | 23 | 23,251 | 0.013% |
| Lithuania | 21 | 19,950 | 0.012% |
| America | 18 | 29,400 | 0.010% |
| Morocco | 9 | 10,000 | 0.005% |
| Spain | 6 | 7,020 | 0.003% |
| Venezuela | 5 | 5,600 | 0.003% |
| Total | 177713.976 | 185,973,554 | 100.000% |
Source: China Custom
*********************************
Welcome to
The 17th China Ferro-Alloys International Conference
September 23-25 Chongqing, China
Copyright © 2013 Ferro-Alloys.Com. All Rights Reserved. Without permission, any unit and individual shall not copy or reprint!
- [Editor:kangmingfei]
 Daily News
 Research
 Magazine
 Company Database
 Customized Database
 Conferences
 Advertisement
 Trade
Trade


 Online inquiry
 Contact


Tell Us What You Think