

 Save
Save Print
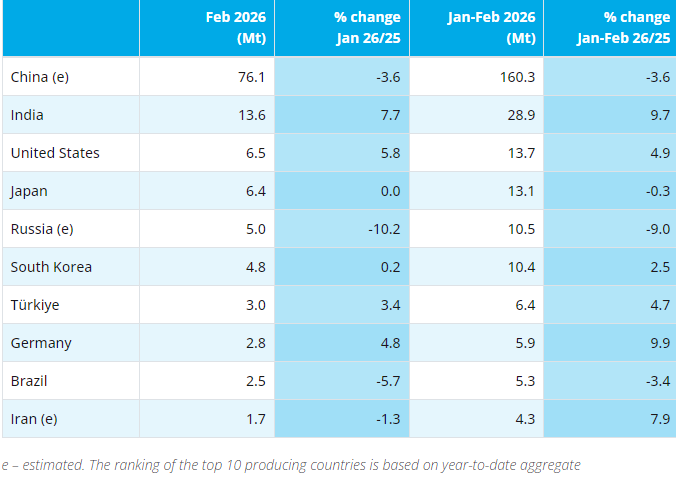
Print[Ferro-Alloys.com] According to data of China Customs, from January to September 2020, China exported 209319.675 tons of ferrosilicon (silicon content > 55%), a year-on-year decrease of 27.61%. Among them, 52648.126 tons were exported to South Korea, accounting for 25.1520%; 48224.107 tons were exported to Japan, accounting for 23.0385%.
| Countries / Areas | Tons | $ | Ratio |
| Korea | 52648.126 | 55,368,145 | 25.1520% |
| Japan | 48224.107 | 53,318,709 | 23.0385% |
| Indonesia | 27646.293 | 29,113,999 | 13.2077% |
| India | 16585.364 | 13,324,444 | 7.9235% |
| Taiwan, China | 13973.935 | 13,598,974 | 6.6759% |
| Vietnam | 11318.55 | 11,340,782 | 5.4073% |
| Mexico | 5779.85 | 6,033,964 | 2.7613% |
| Thailand | 5515.95 | 5,645,923 | 2.6352% |
| Turkey | 5379.7 | 5,616,534 | 2.5701% |
| Malaysia | 5336.211 | 5,590,448 | 2.5493% |
| Chile | 3752 | 3,979,668 | 1.7925% |
| Australia | 1521 | 1,620,625 | 0.7266% |
| Egypt | 1404 | 1,423,192 | 0.6707% |
| Pakistan | 975 | 883,398 | 0.4658% |
| Bangladesh | 873 | 811,785 | 0.4171% |
| UAE | 749 | 830,642 | 0.3578% |
| Brazil | 693.04 | 719,153 | 0.3311% |
| Canada | 665 | 712,425 | 0.3177% |
| New Zealand | 648 | 646,560 | 0.3096% |
| Ukraine | 610 | 519,289 | 0.2914% |
| Saudi Arabia | 564 | 561,968 | 0.2694% |
| Philippines | 488 | 518,840 | 0.2331% |
| Myanmar | 340.969 | 271,248 | 0.1629% |
| Greece | 300 | 310,500 | 0.1433% |
| Bahrain | 297.3 | 332,135 | 0.1420% |
| Guatemalan | 254 | 275,055 | 0.1213% |
| South Africa | 225 | 158,401 | 0.1075% |
| Columbia | 211 | 212,555 | 0.1008% |
| Oman | 200 | 212,852 | 0.0955% |
| Algeria | 200 | 200,000 | 0.0955% |
| New Caledonia | 192 | 178,560 | 0.0917% |
| Ghana | 188 | 193,818 | 0.0898% |
| Israel | 146 | 143,970 | 0.0697% |
| Singapore | 138 | 142,320 | 0.0659% |
| Ecuador | 127 | 146,127 | 0.0607% |
| Mongolia | 120.2 | 108,760 | 0.0574% |
| Albania | 100.08 | 110,167 | 0.0478% |
| Hong Kong, China | 100 | 94,715 | 0.0478% |
| Sudan | 100 | 107,600 | 0.0478% |
| Georgia | 100 | 60,015 | 0.0478% |
| Angola | 79 | 83,060 | 0.0377% |
| Qatar | 60 | 70,200 | 0.0287% |
| Syria | 60 | 57,600 | 0.0287% |
| Nigeria | 54 | 50,220 | 0.0258% |
| Peru | 54 | 53,460 | 0.0258% |
| Jordan | 50 | 53,065 | 0.0239% |
| Heishan | 50 | 49,000 | 0.0239% |
| Iran | 46 | 59,070 | 0.0220% |
| Kuwait | 30 | 37,273 | 0.0143% |
| Russian Federation | 30 | 35,400 | 0.0143% |
| Slovenia | 25 | 23,250 | 0.0119% |
| Uzbekistan | 23 | 23,251 | 0.0110% |
| Lithuania | 21 | 19,950 | 0.0100% |
| Morocco | 19 | 22,440 | 0.0091% |
| America | 18 | 29,400 | 0.0086% |
| Spain | 6 | 7,020 | 0.0029% |
| Venezuela | 5 | 5,600 | 0.0024% |
| Total | 209319.675 | 216,117,524 | 100.0000% |
Data source: China Customs
********************
The 2nd China Manganese Rich-Slag Technology Innovation and Policy Summit
Beijing, China Oct. 30-31 2020

Copyright © 2013 Ferro-Alloys.Com. All Rights Reserved. Without permission, any unit and individual shall not copy or reprint!
- [Editor:kangmingfei]
 Daily News
 Research
 Magazine
 Company Database
 Customized Database
 Conferences
 Advertisement
 Trade
Trade


 Online inquiry
 Contact


Tell Us What You Think