

 Save
Save Print
PrintWorld crude steel production for the 64 countries reporting to the World Steel Association (worldsteel) was 174.4 million tonnes (Mt) in May 2021, a 16.5% increase compared to May 2020.
Crude steel production by region
Africa produced 1.3 Mt in May 2021, up 65.1% on May 2020. Asia and Oceania produced 128.4 Mt, up 11.7%. The CIS produced 9.1 Mt, up 14.8%. The EU (27) produced 13.5 Mt, up 32.7%. Europe, Other produced 4.2 Mt, up 36.9% The Middle East produced 3.7 Mt, up 16.8%. North America produced 10.1 Mt, up 47.7%. South America produced 3.9 Mt, up 49.7%.
The 64 countries included in this table accounted for approximately 98% of total world crude steel production in 2020. Regions and countries covered by the table:
| Table 1. Crude steel production by region | ||||
| May 2021 (Mt) | % change May 21/20 | Jan-May 2021 (Mt) | % change Jan-May 21/20 | |
| Africa | 1.3 | 65.1 | 6.5 | 24.4 |
| Asia and Oceania | 128.4 | 11.7 | 616.5 | 14.9 |
| CIS | 9.1 | 14.8 | 44.3 | 8.4 |
| EU (27) | 13.5 | 32.7 | 64.4 | 15.3 |
| Europe, Other | 4.2 | 36.9 | 20.9 | 17.3 |
| Middle East | 3.7 | 16.8 | 17.8 | 8.1 |
| North America | 10.1 | 47.7 | 48.4 | 11.3 |
| South America | 3.9 | 49.7 | 18.7 | 24.1 |
| Total 64 countries | 174.4 | 16.5 | 837.5 | 14.5 |
Africa: Egypt, Libya, South Africa
Asia and Oceania: Australia, China, India, Japan, New Zealand, Pakistan, South Korea, Taiwan (China), Vietnam
CIS: Belarus, Kazakhstan, Moldova, Russia, Ukraine, Uzbekistan
European Union (27)
Europe, Other: Bosnia-Herzegovina, Macedonia, Norway, Serbia, Turkey, United Kingdom
Middle East: Iran, Qatar, Saudi Arabia, United Arab Emirates
North America: Canada, Cuba, El Salvador, Guatemala, Mexico, United States
South America: Argentina, Brazil, Chile, Colombia, Ecuador, Paraguay, Peru, Uruguay, Venezuela
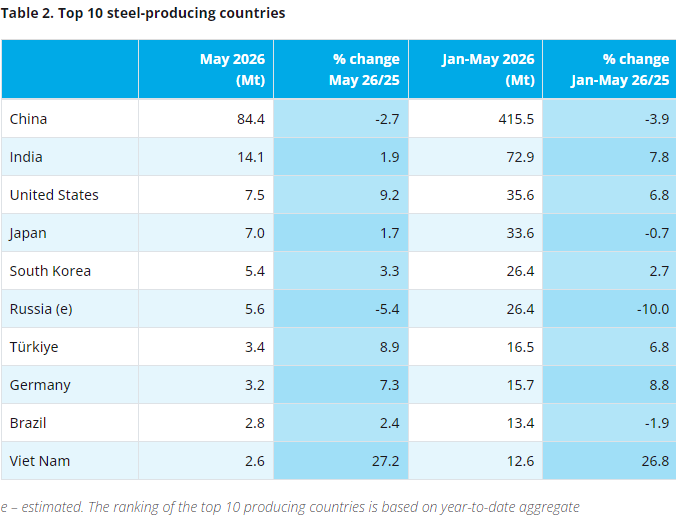
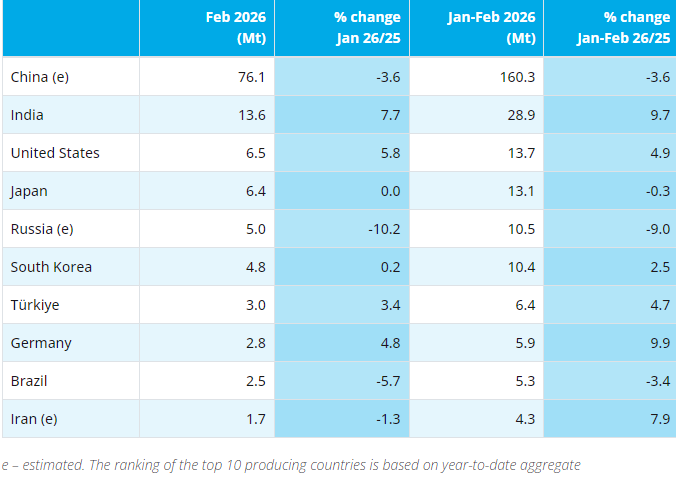
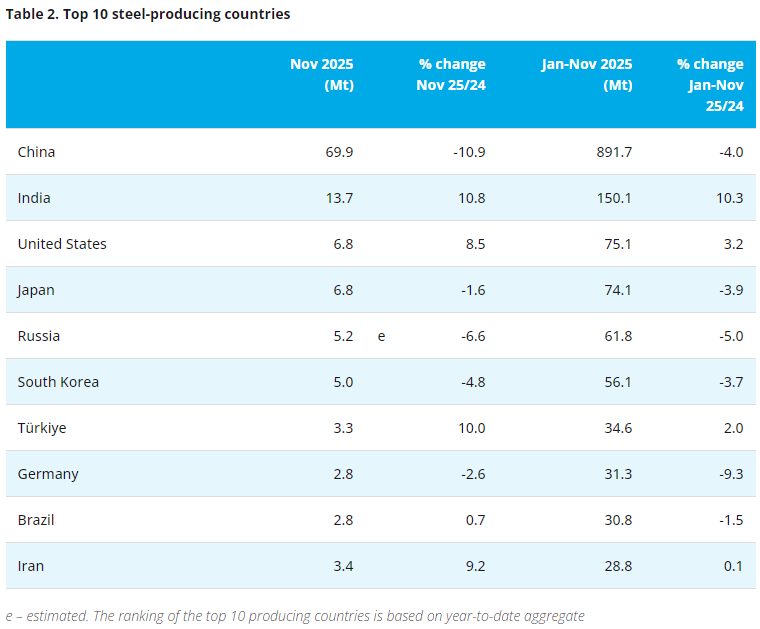
Top 10 steel-producing countries
China produced 99.5 Mt in May 2021, up 6.6% on May 2020. India produced 9.2 Mt, up 46.9%. Japan produced 8.4 Mt, up 42.2%. The United States produced 7.2 Mt, up 47.6%. Russia is estimated to have produced 6.6 Mt, up 14.0%. South Korea is estimated to have produced 6.0 Mt, up 10.5%. Germany is estimated to have produced 3.5 Mt, up 35.5%. Turkey produced 3.2 Mt, up 42.4%. Brazil produced 3.2 Mt, up 40.1%. Iran is estimated to have produced 2.6 Mt, up 7.7%.
| Table 2. Top 10 steel-producing countries | |||||
| May 2021 (Mt) | % change May 21/20 | Jan-May 2021 (Mt) | % change Jan-May 21/20 | ||
| China | 99.5 | 6.6 | 473.1 | 13.9 | |
| India | 9.2 | 46.9 | 48.6 | 33.6 | |
| Japan | 8.4 | 42.2 | 40 | 9.1 | |
| United States | 7.2 | 47.6 | 34.8 | 10.6 | |
| Russia | 6.6 | e | 14 | 31.9 | 7.9 |
| South Korea | 6 | e | 10.5 | 29.3 | 6.9 |
| Germany | 3.5 | e | 35.5 | 17 | 13.6 |
| Turkey | 3.2 | 42.4 | 16.3 | 21.2 | |
| Brazil | 3.2 | 40.1 | 14.9 | 20.3 | |
| Iran | 2.6 | e | 7.7 | 12.5 | 9.2 |
e - estimated. Ranking of top 10 producing countries is based on year-to-date aggregate
Source: worldsteel
Copyright © 2013 Ferro-Alloys.Com. All Rights Reserved. Without permission, any unit and individual shall not copy or reprint!
- [Editor:kangmingfei]
 Daily News
 Research
 Magazine
 Company Database
 Customized Database
 Conferences
 Advertisement
 Trade
Trade


 Online inquiry
 Contact


Tell Us What You Think