

 Save
Save Print
Print

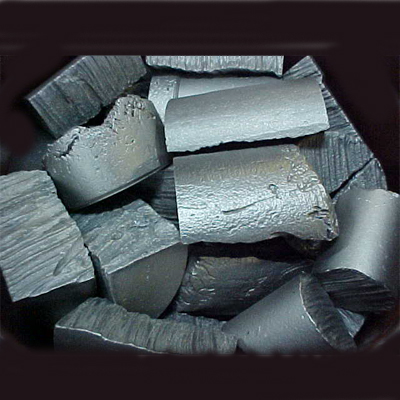
According to data of China Customs, from January to November 2021, China exported 465566.727 tons of ferrosilicon (containing by weight more than 55% of silicon), an increase of 94.66% year-on-year.
Among them, 128241.308 tons were exported to Japan, accounting for 27.55%; 106949.93 tons were exported to South Korea, accounting for 22.97%; 75636.997 tons were exported to Indonesia, accounting for 16.25%.
| Parters | Quantity (tons) | Quantity Proportion | US dollars |
| Japan | 128241.308 | 27.55% | 207,619,119 |
| Korea | 106949.93 | 22.97% | 144,834,014 |
| Indonesia | 75636.997 | 16.25% | 128,651,932 |
| Taiwan, China | 48599.534 | 10.44% | 70,741,833 |
| Vietnam | 23277.786 | 5.00% | 30,777,401 |
| Thailand | 15385.197 | 3.30% | 22,402,717 |
| Mexico | 11951 | 2.57% | 19,690,462 |
| India | 11028.95 | 2.37% | 11,969,850 |
| Malaysia | 9045.35 | 1.94% | 15,563,145 |
| Chile | 6778 | 1.46% | 11,085,943 |
| Turkey | 4610 | 0.99% | 5,536,666 |
| Australia | 2712.711 | 0.58% | 4,881,131 |
| Pakistan | 2387.06 | 0.51% | 3,497,652 |
| Algeria | 2240 | 0.48% | 3,389,680 |
| The People's Republic of Bangladesh | 1835 | 0.39% | 2,667,945 |
| the Philippines | 1832.948 | 0.39% | 3,415,976 |
| Qatar | 1271.908 | 0.27% | 2,018,320 |
| Greece | 1173.75 | 0.25% | 2,242,863 |
| The United Arab Emirates | 934 | 0.20% | 1,630,493 |
| New Zealand | 886 | 0.19% | 1,203,280 |
| U.S.A | 758 | 0.16% | 1,000,420 |
| Egypt | 708 | 0.15% | 1,090,622 |
| Colombia | 607 | 0.13% | 875,921 |
| Singapore | 575.048 | 0.12% | 842,107 |
| Brazil | 568.4 | 0.12% | 840,930 |
| Venezuela | 567 | 0.12% | 908,820 |
| Myanmar | 527 | 0.11% | 681,825 |
| Oman | 524 | 0.11% | 762,050 |
| Saudi Arabia | 503 | 0.11% | 772,040 |
| Ecuador | 479.5 | 0.10% | 731,648 |
| Israel | 405 | 0.09% | 938,250 |
| Peru | 344 | 0.07% | 507,237 |
| Morocco | 325 | 0.07% | 439,915 |
| Bahrain | 313 | 0.07% | 543,535 |
| New Caledonia | 216 | 0.05% | 583,200 |
| Ukraine | 196.6 | 0.04% | 283,848 |
| Mongolia | 182.3 | 0.04% | 249,705 |
| South Africa | 156 | 0.03% | 193,081 |
| Guatemala | 150 | 0.03% | 233,000 |
| Jordan | 131 | 0.03% | 196,600 |
| Britain | 110 | 0.02% | 128,190 |
| Djibouti | 100 | 0.02% | 151,125 |
| Dominican republic | 100 | 0.02% | 232,000 |
| Nigeria | 62.5 | 0.01% | 76,274 |
| Georgia | 50 | 0.01% | 35,100 |
| Iran | 44 | 0.01% | 50,106 |
| Russian Federation | 41 | 0.01% | 78,200 |
| Kenya | 26 | 0.01% | 37,232 |
| Argentina | 10 | 0.002% | 17,000 |
| Mauritania | 4.95 | 0.001% | 4,950 |
| Mozambique | 3 | 0.001% | 2,846 |
| Slovenia | 2 | 0.0004% | 7,825 |
| Total | 465566.727 | 100.00% | 707,316,024 |
Copyright © 2013 Ferro-Alloys.Com. All Rights Reserved. Without permission, any unit and individual shall not copy or reprint!
- [Editor:kangmingfei]
 Daily News
 Research
 Magazine
 Company Database
 Customized Database
 Conferences
 Advertisement
 Trade
Trade


 Online inquiry
 Contact


Tell Us What You Think