

 Save
Save Print
Print[Ferro-Alloys.com]
December 2023 crude steel production and 2023 global crude steel production totals
December 2023 crude steel production
World crude steel production for the 71 countries reporting to the World Steel Association (worldsteel) was 135.7 million tonnes (Mt) in December 2023, a 5.3% decrease compared to December 2022.
Crude steel production by region
| Dec 2023 (Mt) | % change Dec 23/22 | Jan-Dec 2023 (Mt) | % change Jan-Dec 23/22 | |
| Africa | 1.9 | 17.7 | 22 | 5.7 |
| Asia and Oceania | 96.4 | -9.7 | 1,367.20 | 0.7 |
| EU (27) | 9.1 | 2.7 | 126.3 | -7.4 |
| Europe, Other | 3.9 | 19.4 | 41.7 | -4.6 |
| Middle East | 4.9 | 9.6 | 53.2 | 1.3 |
| North America | 9.3 | 5.3 | 109.6 | -1.7 |
| Russia & other CIS + Ukraine | 7.1 | 11.8 | 88.1 | 4.5 |
| South America | 3.2 | -3.2 | 41.5 | -5.7 |
| Total 71 countries | 135.7 | -5.3 | 1,849.70 | -0.1 |
The 71 countries included in this table accounted for approximately 98% of total world crude steel production in 2022.
Regions and countries covered by the table:
Africa: Algeria, Egypt, Libya, Morocco, South Africa, Tunisia
Asia and Oceania: Australia, China, India, Japan, Mongolia, New Zealand, Pakistan, South Korea, Taiwan (China), Thailand, Viet Nam
European Union (27): Austria, Belgium, Bulgaria, Croatia, Czechia, Finland, France, Germany, Greece, Hungary, Italy, Luxembourg, Netherlands, Poland, Portugal, Romania, Slovakia, Slovenia, Spain, Sweden
Europe, Other: Macedonia, Norway, Serbia, Türkiye, United Kingdom
Middle East: Bahrain, Iran, Iraq, Jordan, Kuwait, Oman, Qatar, Saudi Arabia, United Arab Emirates, Yemen
North America: Canada, Cuba, El Salvador, Guatemala, Mexico, United States
Russia & other CIS + Ukraine: Belarus, Kazakhstan, Russia, Ukraine
South America: Argentina, Brazil, Chile, Colombia, Ecuador, Paraguay, Peru, Uruguay, Venezuela
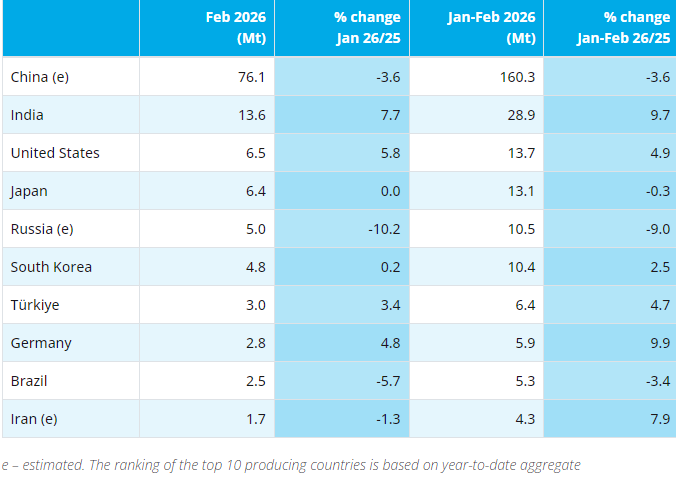
Top 10 steel-producing countries
| Dec 2023 (Mt) | % change Dec 23/22 | Jan-Dec 2023 (Mt) | % change Jan-Dec 23/22 | ||
| China | 67.4 | -14.9 | 1,019.10 | 0 | |
| India | 12.1 | 9.5 | 140.2 | 11.8 | |
| Japan | 7 | 1.1 | 87 | -2.5 | |
| United States | 6.8 | 7.6 | 80.7 | 0.2 | |
| Russia | 6 | e | 4.3 | 75.8 | 5.6 |
| South Korea | 5.4 | 2.7 | 66.7 | 1.3 | |
| Germany | 2.6 | -2.3 | 35.4 | -3.9 | |
| Türkiye | 3.2 | 21.2 | 33.7 | -4 | |
| Brazil | 2.5 | 0.9 | 31.9 | -6.5 | |
| Iran | 2.9 | 12.1 | 31.1 | 1.8 |
e – estimated. Ranking of the top 10 producing countries is based on year-to-date aggregate
2023 global crude steel production totals
Total world crude steel production was 1,882.7 Mt in 2023.
2023 global crude steel production
| Rank | Country | 2023.0 | 2022.0 | %2023/2022 |
| 1 | China | 1019.1 | 1018.0 | 0.1 |
| 2 | India | 140.2 | 125.4 | 11.8 |
| 3 | Japan | 87.0 | 89.2 | -2.5 |
| 4 | United States | 80.7 | 80.5 | 0.2 |
| 5 | Russia (e) | 75.8 | 71.7 | 5.6 |
| 6 | South Korea | 66.7 | 65.8 | 1.3 |
| 7 | Germany | 35.4 | 36.9 | -3.9 |
| 8 | Turkey | 33.7 | 35.1 | -4 |
| 9 | Brazil | 31.9 | 34.1 | -6.5 |
| 10 | Iran | 31.1 | 30.6 | 1.8 |
| 11 | Italy | 21.1 | 21.6 | -2.4 |
| 12 | Viet Nam (e) | 19.0 | 20.0 | -5 |
| 13 | Taiwan, China (e) | 18.9 | 20.8 | -8.9 |
| 14 | Mexico (e) | 16.3 | 18.4 | -11.6 |
| 15 | Indonesia (e) | 16.0 | 15.6 | 2.8 |
| 16 | Canada (e) | 12.3 | 12.1 | 1.3 |
| 17 | Spain | 11.3 | 11.6 | -2.7 |
| 18 | Egypt | 10.4 | 9.8 | 5.4 |
| 19 | France | 10.0 | 12.1 | -17.4 |
| 20 | Saudi Arabia | 9.9 | 9.9 | 0.8 |
| 21 | Malaysia (e) | 7.5 | 7.2 | 4.1 |
| 22 | Austria | 7.1 | 7.5 | -5 |
| 23 | Poland (e) | 6.4 | 7.4 | -13.1 |
| 24 | Ukraine | 6.2 | 6.3 | -0.6 |
| 25 | Belgium (e) | 5.9 | 7.0 | -16.1 |
| 26 | United Kingdom | 5.6 | 6.0 | -6.5 |
| 27 | Bangladesh (e) | 5.5 | 5.2 | 5.8 |
| 28 | Australia | 5.5 | 5.6 | -2.9 |
| 29 | Pakistan (e) | 5.3 | 6.0 | -11.3 |
| 30 | Thailand (e) | 5.0 | 5.3 | -6.7 |
| 31 | Argentina | 4.9 | 5.1 | -3.2 |
| 32 | South Africa | 4.9 | 4.4 | 10.6 |
| 33 | Netherlands | 4.7 | 6.1 | -23.9 |
| 34 | Slovakia (e) | 4.5 | 3.9 | 15.4 |
| 35 | Algeria | 4.4 | 4.3 | 2.8 |
| 36 | Sweden | 4.3 | 4.4 | -3.3 |
| 37 | Kazakhstan | 3.9 | 4.1 | -5.5 |
| 38 | Finland | 3.8 | 3.5 | 7.7 |
| 39 | Czechia | 3.4 | 4.3 | -21.1 |
| 40 | United Arab Emirates | 3.2 | 3.2 | 0.8 |
| Others | 39.6 | 41.4 | -4.4 | |
| World | 1888.2 | 1887.6 | 0 |
e – annual figure estimated using partial data or non-worldsteel resources.
Source: Worldsteel

Copyright © 2013 Ferro-Alloys.Com. All Rights Reserved. Without permission, any unit and individual shall not copy or reprint!
- [Editor:邢亚敏]
 Daily News
 Research
 Magazine
 Company Database
 Customized Database
 Conferences
 Advertisement
 Trade
Trade


 Online inquiry
 Contact


Tell Us What You Think