

 Save
Save Print
Print[Ferro-Alloys.com] Tshipi :Q4 FY2025 Quarterly Activities Report
Tshipi Highlights
Tshipi delivered its strongest performance on record this year, including record manganese sales, highest-ever mining volumes and record tonnes of material processed
Sales of 1,088,548 tonnes (40% increase on previous quarter, 2% increase on prior year corresponding period (PCP)). Tshipi ended FY2025 with 3,587,219 tonnes sold, a new record for the mine
Production of 787,905 tonnes (8% decrease on previous quarter, 14% decrease on PCP) with full year production of 3,603,114 tonnes, representing a new record of material processed
Cost of production US$2.36 per dmtu FOB (14% increase on previous quarter, 6% decrease on PCP)
One LTI in the quarter, TRIFR remained at 0.38 (last quarter 0.38)
Tshipi earnings lower in the June 2025 quarter – EBITDA of A$40.9m (8% decrease on previous quarter). Cash (A$128.8m) also marginally reduced due to tax and royalty payments (1% decrease on previous quarter end)
Q4 FY2025 Quarterly Activities Report: Summary The June 2025 quarter saw materially increased sales volumes, contributing to a record sales achievement in FY25.
On-land logistics volumes decreased 3% during the quarter. Low-grade ore was processed during the quarter for the first time since Q1 FY2025.
Tshipi EBITDA decreased by 8% on the previous quarter, driven by a combination of lower realised manganese prices, as well as an increase in the unit cost of production in the quarter. Cash decreased slightly after payment of half-yearly taxes and royalties.
The June 2025 quarter saw average (realised) manganese prices (US$3.86/dmtu, CIF) that were 4% lower than the March 2025 quarter average (US$4.03/dmtu, CIF). This was mainly due to increased ore supply, resulting in a 19% increase in stocks of manganese ore at port in China during the quarter (although stock levels remain below five-year average levels).
The spot price at 30 June 2025 was US$3.83/dmtu (CIF). At the end of July 2025 the spot price is US$3.99/dmtu (CIF), 4% higher than the price seen at the end of the June 2025 quarter.
Freight rates slightly improved, to US$22.96 per tonne, at the end of the June 2025 quarter (Port Elizabeth to Tianjin) compared with US$23.70 per tonne at the start of the June 2025 quarter (3% improvement), however freight rates increased by the end of July 2025 (US$26.24, a 14% increase).
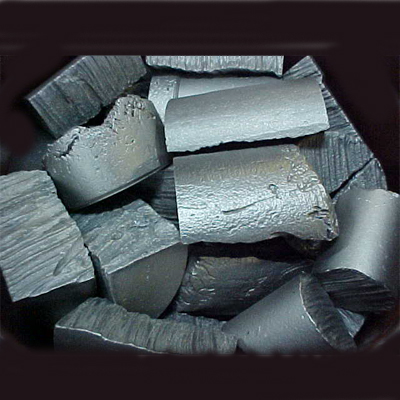
Tshipi Manganese Mine
Key production, sales and financial information for Tshipi for the quarter ended 30 June 2025, and comparatives, are presented below:
|
Key Statistic |
Unit |
Q4 FY2025 |
Q3 FY2025 |
Q2 FY2025 |
Q1 FY2025 |
FY2025 |
Q4 FY2024 |
|
Production |
Tonnes |
787,905 |
858,152 |
745,167 |
1,211,890 |
3,603,114 |
913,961 |
|
Total sales |
Tonnes |
1,088,548 |
777,229 |
683,090 |
1,038,352 |
3,587,219 |
1,065,343 |
|
Average CIF price achieved (HGL) |
US$/dmtu |
3.86 |
4.03 |
3.72 |
4.28 |
4.02 |
4.42 |
|
Average FOB price achieved (HGL) |
US$/dmtu |
3.28 |
3.42 |
3.02 |
3.01 |
3.26 |
3.53 |
|
Average FOB cost of production |
US$/dmtu |
2.36 |
2.06 |
2.43 |
2.33 |
2.30 |
2.50 |
|
Earnings before interest, tax and depreciation (EBITDA) |
A$ million |
40.9 |
44.3 |
26.9 |
21.0 |
133.1 |
60.4 |
|
Net profit after tax (NPAT) |
A$ million |
25.9 |
28.3 |
17.2 |
13.7 |
85.1 |
38.7 |
|
Cash at bank |
A$ million |
128.8 |
130.5 |
141.4 |
96.8 |
128.8 |
82.2 |
|
MINING AND PRODUCTION |
|
||||||
|
|
Q4 FY2025 |
Q3 FY2025 |
Q2 FY2025 |
Q1 FY2025 |
Q4 FY2024 |
||
|
Mined volume |
|
|
|
|
|
||
|
bcm |
3,418,275 |
3,290,517 |
3,571,638 |
3,777,760 |
14,058,190 |
2,974,703 |
|
bcm |
165,131 |
235,076 |
283,142 |
273,052 |
956,401 |
214,928 |
|
Total |
|
3,583,406 |
3,525,593 |
3,854,780 |
4,050,812 |
15,014,591 |
3,189,631 |
|
Production |
|
|
|
|
|
|
|
|
Tonnes |
676,063 |
858,152 |
745,167 |
953,474 |
3,232,856 |
711,109 |
|
Tonnes |
111,842 |
- |
- |
258,416 |
370,258 |
202,852 |
|
Total |
|
787,905 |
858,152 |
745,167 |
1,211,890 |
3,603,114 |
913,961 |
|
Average FOB cost of production (HGL) US$/dmtu |
2.36 |
2.06 |
2.43 |
2.33 |
2.30 |
2.50 |
|
Mining of graded ore decreased 30% due to rainwater in the pit, while waste mining volumes increased by 4% from the previous quarter. Overall mining volumes achieved for FY2025 were an all-time record for Tshipi.
Tshipi high-grade production decreased by 21%, due to the slower mining affected by the abovementioned water in the pit. Production for the full year exceeded plan and Tshipi achieved a new record for all material processed through the production plant. Low-grade ore was produced for the first time since the first quarter of FY2025.
Cost of production increased 14% to US$2.36 on an FOB basis for the quarter (but were 6% lower against the prior corresponding period). The main reasons for the increase were the decrease in graded ore mining and production volumes, contributing to a higher unit rate, and several year-end provisions.
LOGISTICS AND SALES
|
|
Unit |
Q4 FY2025 |
Q3 FY2025 |
Q2 FY2025 |
Q1 FY2025 |
FY2025 |
Q4 FY2024 |
|
On-land logistics |
Tonnes |
856,479 |
885,997 |
703,360 |
977,261 |
3,423,097 |
1,135,456 |
|
Sales |
|
|
|
|
|
|
|
|
Tonnes |
908,488 |
599,102 |
559,090 |
914,074 |
2,980,754 |
783,512 |
|
Tonnes |
180,060 |
178,127 |
124,000 |
115,335 |
597,522 |
263,163 |
|
Tonnes |
- |
- |
- |
8,943 |
8,943 |
18,668 |
|
Total |
|
1,088,548 |
777,229 |
683,090 |
1,038,352 |
3,587,219 |
1,065,343 |
|
Average CIF price achieved (HGL) |
US$/dmtu |
3.86 |
4.03 |
3.72 |
4.28 |
4.02 |
4.42 |
|
Average FOB price achieved (HGL) |
US$/dmtu |
3.28 |
3.42 |
3.02 |
3.01 |
3.26 |
3.53 |
Logistics volumes decreased by 3% for the quarter, with South African road haulage increasing in June 2025 owing to derailments at the time.
Sales volumes increased in the quarter by 40%, achieving a new quarterly export record and contributing to the record sales achieved for the full year. Both logistics and sales volumes for the full year exceeded plan.
CORPORATE AND FINANCIAL
Tshipi recorded an EBITDA of A$40.9 million and NPAT of A$25.9 million for the quarter, a decrease on the previous quarter (A$44.3 million and A$28.3 million, respectively). The slight decrease was due to a combination of lower realised manganese prices, and an increase in unit cost of production in the quarter.
During the quarter, it was announced that Exxaro Resources Limited had entered into a binding agreement to acquire a 50.1% ownership interest in Tshipi from Ntsimbintle Holdings (Pty) Ltd and OM Holdings Limited. The transaction is subject to certain conditions, including the receipt of regulatory approvals in South Africa. Following the transaction, Jupiter will continue to hold the remaining 49.9% of Tshipi. The terms of the Shareholder Agreement and accordingly Jupiter’s rights are unaffected by this transaction.
Marketing and Marketing Outlook
JUPITER MARKETING
Sales and financial information for Jupiter’s marketing entity for the quarter ended 30 June 2025, as well as comparatives, are presented below.
The prices shown below relate to the prices realised by Jupiter’s marketing team for the 49.9% share of Tshipi sales that are marketed by Jupiter.
|
|
Unit |
Q4 FY2025 |
Q3 FY2025 |
Q2 FY2025 |
Q1 FY2025 |
FY2025 |
Q4 FY2024 |
|
Sales |
Tonnes |
517,600 |
379,409 |
359,715 |
535,018 |
1,791,742 |
608,779 |
|
Average CIF price achieved (HGL)2 |
US$/dmtu |
4.03 |
4.14 |
3.72 |
4.34 |
4.07 |
4.74 |
|
Average FOB price achieved (HGL)3 |
US$/dmtu |
3.36 |
3.55 |
3.04 |
3.04 |
3.31 |
3.94 |
|
Marketing fee income |
A$ million |
2.7 |
2.3 |
1.9 |
2.5 |
9.4 |
3.5 |
|
EBITDA |
A$ million |
2.5 |
2.1 |
1.7 |
2.3 |
8.6 |
3.3 |
|
NPAT |
A$ million |
1.7 |
1.5 |
1.5 |
1.6 |
6.3 |
2.4 |
|
Cash at bank |
A$ million |
2.9 |
2.4 |
3.7 |
2.2 |
2.9 |
2.1 |
MARKET COMMENTARY AND OUTLOOK
At the beginning of the June 2025 quarter, the manganese ore market was negatively impacted by geopolitical and macroeconomic factors, particularly due to the widespread trade tariffs levied by United States of America. These proposed tariffs created uncertainty for most economies and industries, not sparing metal commodities and the associated steel industry. Whilst the 90 day tariff pause and later talks between the two biggest economies both provided temporary relief, weak confidence prevailed.
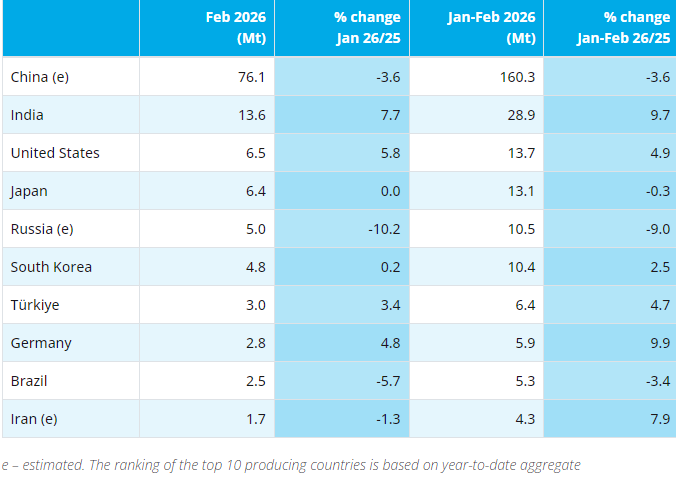
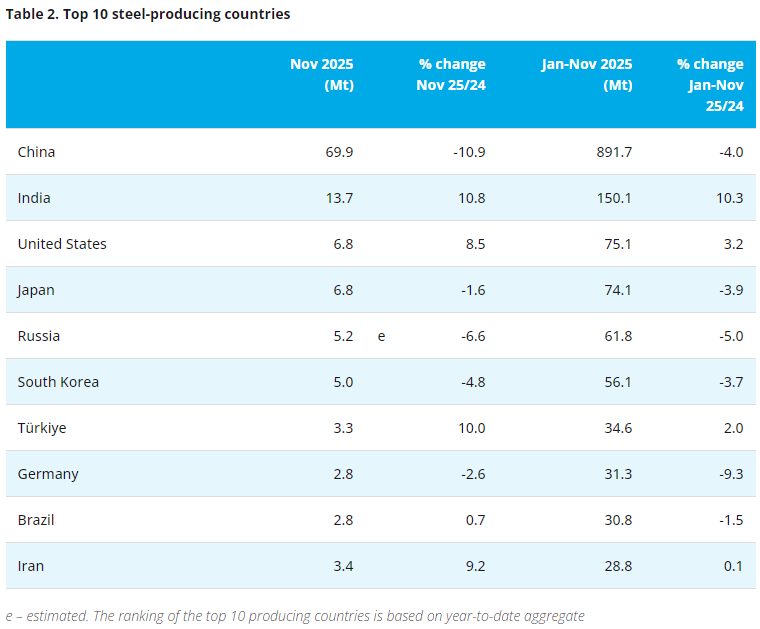
The Worldsteel Association reported a 5% year-on-year decline in Chinese crude steel production for the quarter, with global crude steel production reportedly declining by 3% year-on-year.
Manganese ore supply from major producing regions increased during the quarter, in response to an uptick in concluded prices late in the previous quarter. The resumption of exports from the Groote Eylandt mine in Australia also contributed to additional manganese ore supply during the quarter.
Whilst reported silicon manganese output in China declined on a quarterly basis, production remains at healthy levels and oversupply persists when considering alloy stocks and especially the current seasonally weak steel activity in the country. These factors also impacted silicon manganese prices, and alloy plants margins, during the quarter.
Outside of China, manganese alloy demand was similarly impacted by weak downstream demand amidst geopolitical events.
Manganese ore inventory levels at main ports in China rose through the quarter in response to the above mentioned increase in supply. Port inventory levels remain at low levels considering the past five-year average of circa 5.86 million tonnes, as reported.
Overall, notwithstanding the initial decline in manganese ore prices early in the quarter, prices were generally rangebound for the remainder of the quarter. Freight rates also moved within a narrow range throughout the quarter.
Post quarter end, manganese ore prices have shown signs of improvement. Most recent gains in prices are in response to positive downstream price movements, and in anticipation of macroeconomic stimulus measures in China to stabilise and support growth in a number of industries including steel.
|
Key market prices |
Unit |
Today (end Jul 2025) |
% change since 30 Jun 2025 |
30 Jun 2025 |
31 Mar 2025 |
31 Dec 2024 |
30 Sep 2024 |
30 Jun 2024 |
|
Mn ore 37% FOB Port Elizabeth |
US$/dmtu |
3.27 |
2% |
3.20 |
3.62 |
3.30 |
3.00 |
4.82 |
|
Freight rate Port Elizabeth to Tianjin (estimate) |
US$/dmtu |
26.24 |
14% |
22.96 |
23.70 |
24.00 |
26.80 |
30.60 |
|
Total stock at Chinese ports |
‘000 tonnes |
4,427 |
3% |
4,300 |
3,600 |
5,179 |
5,973 |
5,071 |
- [Editor:tianyawei]
 Daily News
 Research
 Magazine
 Company Database
 Customized Database
 Conferences
 Advertisement
 Trade
Trade


 Online inquiry
 Contact


Tell Us What You Think