

 Save
Save Print
Print
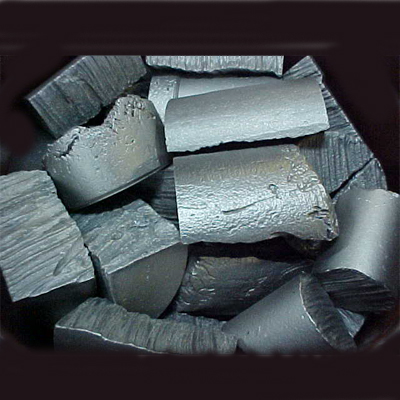
According to data of Trade Statistics of Japan, from January to November 2021, Japan imported 382048.604 tons of ferrosilicon (containing by weight more than 55% of silicon), an increase of 29.75% year-on-year.
Among them, 133584.259 tons were imported from China, accounting for 34.97%; 123533.754 tons were imported from Russia, accounting for 32.33%.
| COUNTRY NAME | CURRENT MONTH QUANTITY (TONS) | CURRENT MONTH VALUE (1000YEN) | CUMULATIVE YEAR TO DATE QUANTITY (TONS) | CUMULATIVE YEAR TO DATE VALUE (1000YEN) |
| TAIWAN, CHINA | - | - | 342.15 | 60629 |
| THAILND | - | - | 503 | 105370 |
| KUWAIT | - | - | 1136.447 | 118495 |
| SLOVENI | - | - | 4.535 | 1081 |
| CHINA | 10956.416 | 3541652 | 133584.259 | 25234339 |
| BRAZIL | 6216.7 | 1592715 | 41364.5 | 8887434 |
| RUSSIA | 5730.19 | 1840677 | 123533.754 | 22281996 |
| MALYSIA | 3135.33 | 671451 | 41032.647 | 6827613 |
| ICELAND | 1758.5 | 383633 | 13866.8 | 2764462 |
| NORWAY | 1092.5 | 258719 | 7613.44 | 1595379 |
| KAZAKHS | 714 | 198637 | 10437.336 | 1455107 |
| FRANCE | 494.64 | 105168 | 2125.24 | 419533 |
| VIETNAM | 149.874 | 70236 | 6470.392 | 1335167 |
| INDIA | 7 | 1738 | 29 | 6248 |
| GERMANY | 3.7 | 2446 | 5.104 | 3745 |
| TOTAL | 30258.85 | 8667072 | 382048.604 | 71096598 |
Copyright © 2013 Ferro-Alloys.Com. All Rights Reserved. Without permission, any unit and individual shall not copy or reprint!
- [Editor:kangmingfei]
 Daily News
 Research
 Magazine
 Company Database
 Customized Database
 Conferences
 Advertisement
 Trade
Trade


 Online inquiry
 Contact


Tell Us What You Think