

 Save
Save Print
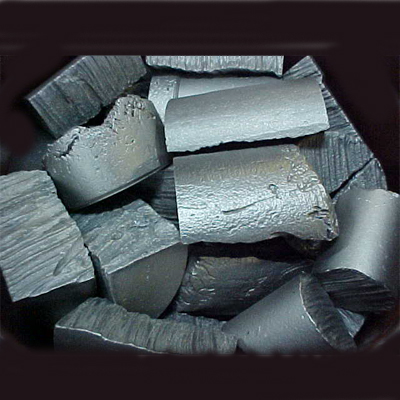
PrintAccording to data of China Customs, from January to July 2023, China exported 242038.341 tons of ferrosilicon (containing by weight more than 55% of silicon), a year-on-year decrease of 200259.359 tons, a decrease of 45.28%.
| Partners | Quantity (tons) | Quantity Proportion | US dollars |
| Korea | 59905.929 | 24.75% | 96,820,542 |
| Japan | 50550.581 | 20.89% | 80,227,892 |
| Indonesia | 28810.796 | 11.90% | 47,086,590 |
| Mexico | 16336.14 | 6.75% | 26,399,598 |
| Taiwan, China | 11416.079 | 4.72% | 15,495,163 |
| Thailand | 10401.997 | 4.30% | 15,342,696 |
| India | 8265.5 | 3.41% | 10,331,905 |
| Türkiye | 7582.875 | 3.13% | 10,026,864 |
| Vietnam | 7056.34 | 2.92% | 10,002,792 |
| Britain | 5206 | 2.15% | 8,172,850 |
| Malaysia | 4712 | 1.95% | 6,889,857 |
| Canada | 3305.981 | 1.37% | 5,352,659 |
| Chile | 3082.5 | 1.27% | 4,755,542 |
| UAE | 2450.052 | 1.01% | 3,809,472 |
| Australia | 2073 | 0.86% | 3,291,579 |
| Saudi Arabia | 2059.945 | 0.85% | 3,172,901 |
| Morocco | 1828.767 | 0.76% | 2,902,524 |
| South Africa | 1590.605 | 0.66% | 2,441,378 |
| Egypt | 1141 | 0.47% | 1,148,182 |
| the Philippines | 1103 | 0.46% | 1,595,522 |
| Brazil | 1020.9 | 0.42% | 1,535,898 |
| New Caledonia | 940 | 0.39% | 1,389,200 |
| Colombia | 886 | 0.37% | 1,357,891 |
| Greece | 724 | 0.30% | 1,055,089 |
| Italy | 609.6 | 0.25% | 963,168 |
| Algeria | 600 | 0.25% | 958,708 |
| United States | 593 | 0.25% | 1,058,222 |
| Oman | 575 | 0.24% | 771,021 |
| Myanmar | 571.63 | 0.24% | 748,469 |
| Russia | 548.1 | 0.23% | 1,124,935 |
| Bangladesh | 515 | 0.21% | 709,450 |
| Netherlands | 496 | 0.20% | 764,554 |
| Israel | 482 | 0.20% | 703,050 |
| Peru | 363 | 0.15% | 572,311 |
| Pakistan | 328.2 | 0.14% | 399,818 |
| Hong Kong, China | 300 | 0.12% | 210,100 |
| Qatar | 297 | 0.12% | 381,150 |
| Argentina | 292 | 0.12% | 451,350 |
| Georgia (starting from 2023) | 264 | 0.11% | 241,740 |
| Poland | 241.5 | 0.10% | 202,305 |
| Tunisia | 230 | 0.10% | 333,070 |
| Romania | 208 | 0.09% | 234,792 |
| Djibouti | 179 | 0.07% | 260,340 |
| Kenya | 158 | 0.07% | 229,915 |
| Mozambique | 155 | 0.06% | 243,000 |
| Ecuador | 154.324 | 0.06% | 235,997 |
| Cameroon | 147 | 0.06% | 220,575 |
| Nigeria | 139 | 0.06% | 212,652 |
| Mongolia | 129 | 0.05% | 204,750 |
| Bahrain | 123 | 0.05% | 197,700 |
| Libya | 115 | 0.05% | 187,780 |
| Ghana | 108 | 0.04% | 155,304 |
| Belarus | 92 | 0.04% | 151,800 |
| Dominican | 81 | 0.03% | 134,055 |
| New Zealand | 72 | 0.03% | 112,776 |
| Iran | 64 | 0.03% | 116,600 |
| Slovenia | 53 | 0.02% | 85,600 |
| Cambodia | 50 | 0.02% | 35,500 |
| Syria | 50 | 0.02% | 69,750 |
| Tanzania | 50 | 0.02% | 76,500 |
| Guatemala | 50 | 0.02% | 82,250 |
| Angola | 27 | 0.01% | 37,800 |
| Paraguay | 25 | 0.01% | 41,000 |
| Venezuela | 25 | 0.01% | 37,750 |
| Croatia | 24 | 0.01% | 39,132 |
| Kuwait | 3 | 0.00% | 5,540 |
| Ukraine | 1 | 0.00% | 2,037 |
| Total | 242038.341 | 100.00% | 374608902 |
Copyright © 2013 Ferro-Alloys.Com. All Rights Reserved. Without permission, any unit and individual shall not copy or reprint!
- [Editor:kangmingfei]
 Daily News
 Research
 Magazine
 Company Database
 Customized Database
 Conferences
 Advertisement
 Trade
Trade


 Online inquiry
 Contact


Tell Us What You Think